On this page
A few months back, you decided to set up a multi-cloud architecture to build resilient and operational systems. You separated the database from the application, added a second cloud for backups and read replicas to improve performance. Keeping backups with a second provider helped add another layer of protection.
Each decision solved a real problem. But you didn’t plan for the fourteenth line item on the invoice. It costs four to five times your expected budget.
That item is egress fees: a charge that applies when data leaves a cloud provider, region, service, or network boundary and moves elsewhere.
This charge doesn’t mean you planned the architecture incorrectly. It just means the cost is sitting somewhere your architecture decisions never accounted for.
Your architecture was designed around availability, performance, and recovery time. The billing system measures how many gigabytes leave a region, service, or provider, along with their frequency.
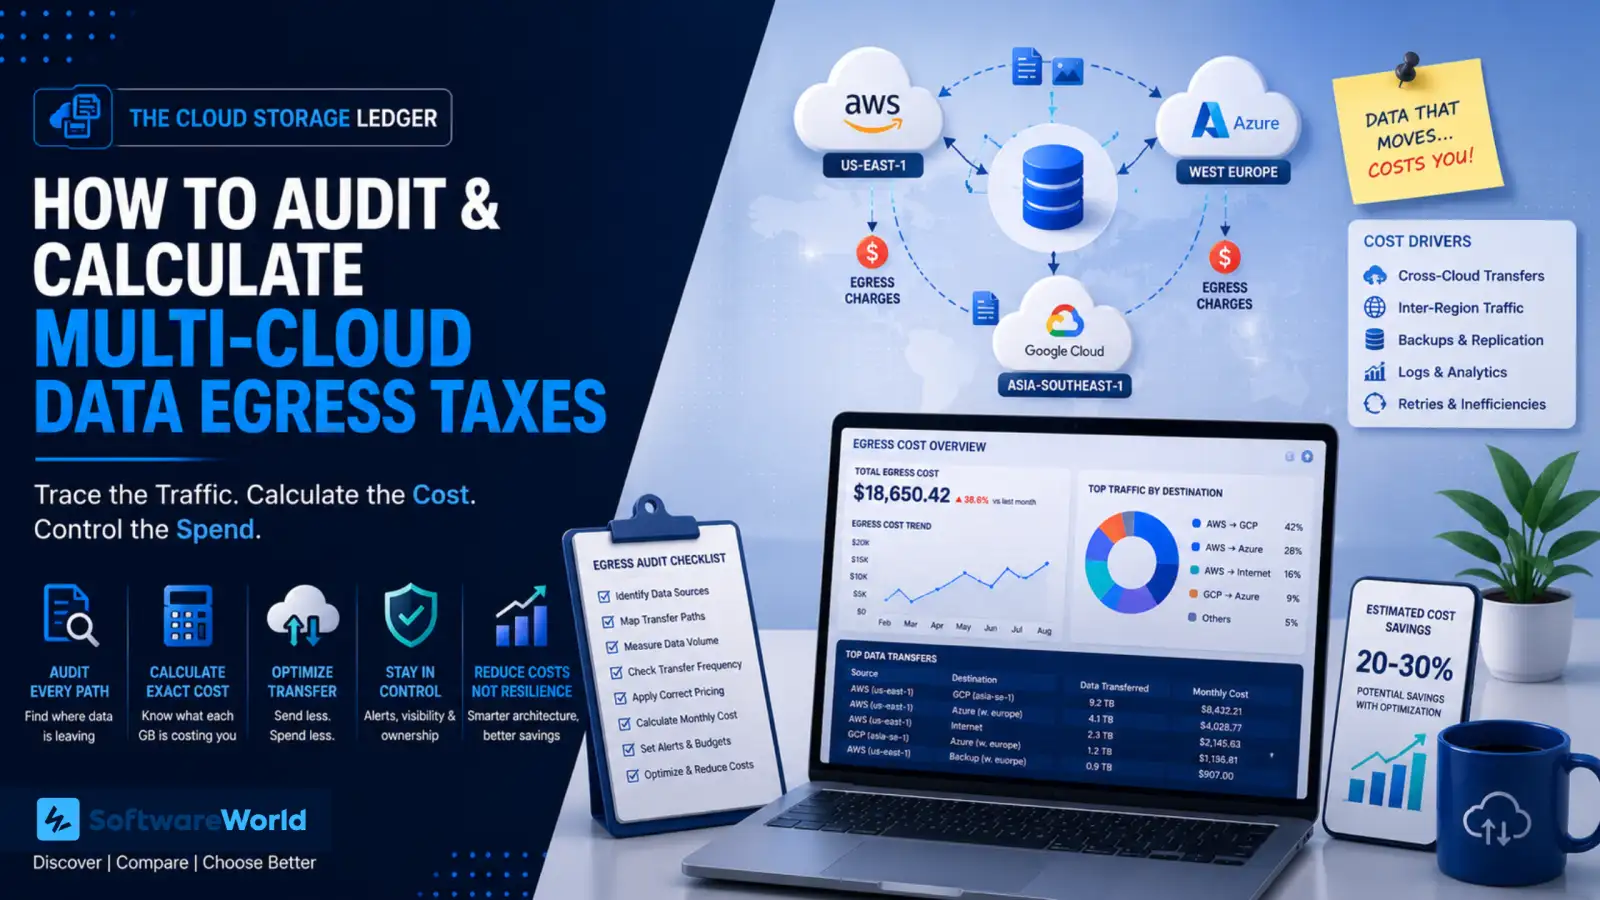
In this guide, we will trace the traffic responsible for multi-cloud data egress fees, calculate what it’s costing you each month, and use that to control the cost without dismantling your multi-cloud setup.
› Why Microservices Create Egress Exposure
With microservices, you can modify applications easily as each service can be developed, deployed and updated independently. That flexibility comes with a trade-off. Some of that complexity automatically moves from your codebase into the network.
When you split one of your applications into multiple services, these services must exchange information. They will either call one another directly, publish events through message brokers or read from a separate database.
That communication doesn’t automatically become a charge on your invoice. But when data crosses a cloud provider or region, it might. That’s exactly what you need to check for.
You may be generating this traffic in places that are easily overlooked.
- Application services reading from or writing to databases
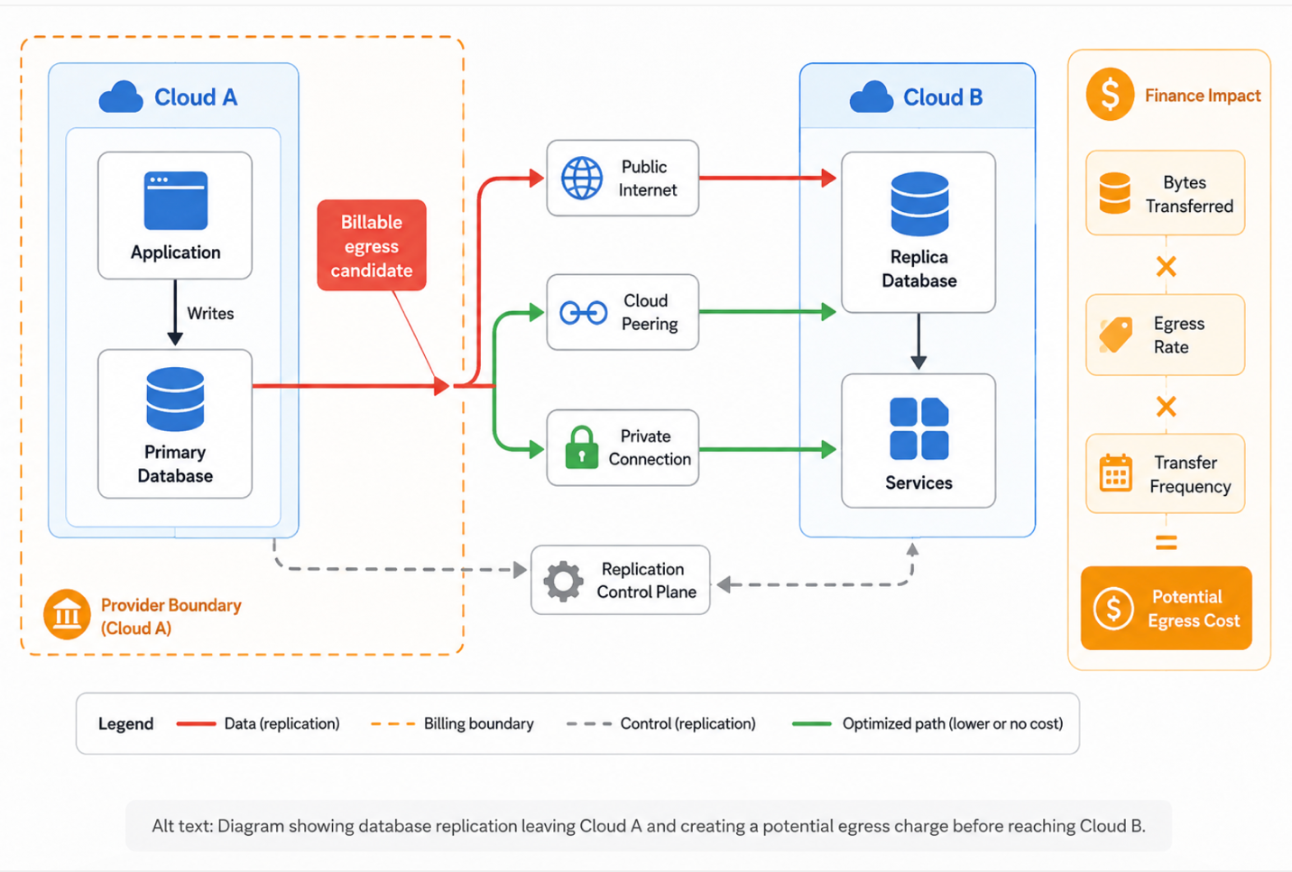
- Primary databases that send changes to their backups and replicas
- Logs, metrics, and even traces moving to storage or another provider
- Backup systems transferring full copies on schedule
- Analytics workloads that pull data for reports
- Kubernetes clusters communicating across regions or different cloud providers
- Retry requests sent after a failure or timeout.
The important question here isn’t “How many services do we run?” It should be “which workloads are sending how much data, where, and how often?”
» Traffic Patterns You Must Audit
| Traffic Pattern | Why They Exist | Cost-based Risk |
| Full Backup Copy | Disaster recovery or a scheduled backup | Size of each copy and the frequency of backup |
| Keeping a Copy Updated | Replicate the database or sync the storage | Runs continuously in the background. Check change rate, volume, and destination |
| Read or Write Calls Between Different Cloud Providers | The application services in different providers need to communicate with each other | The request volume, response size, and provider boundary |
| Sending the Logs to Storage or Other Providers | Centralized monitoring or long-term storage | Log growth, user retention, and data destination |
| Pulling Data for Reports | Reports or data pipelines need source data | Batch size, data movement schedule, and region placement |
| Retrying a Failed Request | A timeout or failure causes requests to be sent again | Retry rate and the duplicated payload volume |
| Kubernetes Region Traffic | Clusters exchange application or control plane data | Pod-to-pod traffic, service mesh overhead, and routing. |
You don’t need to investigate every row with the same sense of urgency. For instance, a scheduled backup may create a noticeable monthly spike, but a small cross-cloud API request may seem harmless at first. But when that request runs thousands of times in a second, the total transfer cost is higher than your backup.
No wonder most teams begin with the wrong question. You look at one large export and egress begins sounding like a storage-export problem. Sometimes that might be the cause. Other times, the higher cost comes from traffic that runs quietly in the background.
- A replica receiving database changes all day
- Analytics service continuously pulling the same data
- Logs being exported to another provider
Key Insight: Your architecture may be operationally distributed while a single recurring transfer path carries a disproportionate share of the financial cost. The goal of your audit should be to find that path, confirm applicable billing rules, and decide if the data should move as often.
› What Cloud Egress Actually Means
Cloud egress simply means your data is leaving one place to go to another. It could move from your current provider, region, or service to another place. Whether that movement costs you anything, and the actual amount, comes down to the path it actually takes.
Think of egress as sending a package to your relative living in another city. You are only concerned whether they will receive it. The billing system you chose cares about the rest: where it left from, where it went, how big it was, which route it took, and how many times you sent it.
It’s generally believed that ingress is free and egress costs you. That may be true in most cases. But free ingress doesn’t mean your cross-cloud setup comes with a zero-transfer cost.
You may incur costs depending on the route your data takes, the providers/regions it passes through before reaching the destination, and where it ends up finally. All of this will add up to form your final bill.
» The Boundaries You Must Check
| Boundary Crossed | Example | Why It Matters |
| Cloud-provider boundary | AWS to GCP | You may be charged the moment traffic leaves the source provider |
| Region Boundary | Mumbai to Singapore | You may incur inter-region rates |
| Availability-zone Boundary | Zone A to Zone B | Even if the traffic stays close to home, it will become billable |
| Service Boundary | Compute to managed database | Different services follow different rules |
| Network Path | Public internet, peering, or dedicated link | The route your data takes can change the price |
| Account or Project Boundary | Separate billing accounts | Discounts and attribution available with one provider may not carry over. |
Width: 0px, Height: 0px
Width: 1292px, Height: 872px
Width: 1292px, Height: 872px
Width: 1292px, Height: 872px
Width: 1292px, Height: 872px
Width: 1292px, Height: 872px
As of August 2026, AWS starts at $0.09/GB for your first 10 TB. GCP runs at $0.12/GB for the premium tier. It is closer to $0.085/GB on standard tiers. Azure rates range from $0.087/GB to $0.181/GB, depending on your zone.
Don’t trust a rate that isn’t attached to the provider, region, volume tier, and date.
Instead, ask yourself: which service is sending this data, where it is going, how much moves, and which rate applies to you. Check for discounts and extra fees that might change the number.
» What Questions to Ask
| Table: What Questions to Ask | Question to Answer |
| Source | Which service is sending the data? |
| Destination | Region, provider, service, or public internet: where will it go? |
| Volume | How many billable gigabytes will leave each month? |
| Frequency | Will it be continuous, scheduled, or retry-driven? |
| Rate | Which current rate applies to your route? |
| Discounts | Do commitments or private connectivity change the discounts? |
This doesn’t mean every cross-cloud transfer is expensive or you must fear egress. It just means the actual cost depends on details your team may never think to check till invoice forces them to ask questions.
You already know where the traffic hides. Now let’s attach a number to it.
› How To Calculate the Monthly Exposure
Let’s understand these traffic paths with some numbers. Say your team transfers a 50GB database snapshot every four hours between two known cloud environments. 50GB is pretty manageable for modern data platforms if your goal is to keep the backup/replica updated.
But your cycle occurs roughly six times per day (repeating every four hours). So, how much data are you transferring in a single month?
50GB * 6 transfers per day *30 days = 9,000 GB in a single month.
You transfer 9 TB of data, and that doesn’t include retries, protocol overhead, additional replicas, or another destination.
Now let’s calculate what it costs you by using the universal cloud price of $0.09 per GB.
9000 GB * $0.09 = $810 per month
Note: Your actual cloud rate will depend on the service provider, their region, route, volume tier, and contract terms. Provider rates can also depend on source region and service. Always use applicable rates from your own billing environment.
Here’s a quick value table to understand what just happened.
» Assumption-Based Calculation
| Assumption | Value |
| Data transferred per sync | 50 GB |
| Sync frequency | Every four hours |
| Syncs in a day | 6 |
| Billing period | 30 days |
| Monthly transferred data | 9,000 GB |
| Universal Rate | $0.09/GB |
| Example Transfer Cost | $810 |
$810 is the result of a decision that looked very small at the application level but became significant when you multiplied it over time.
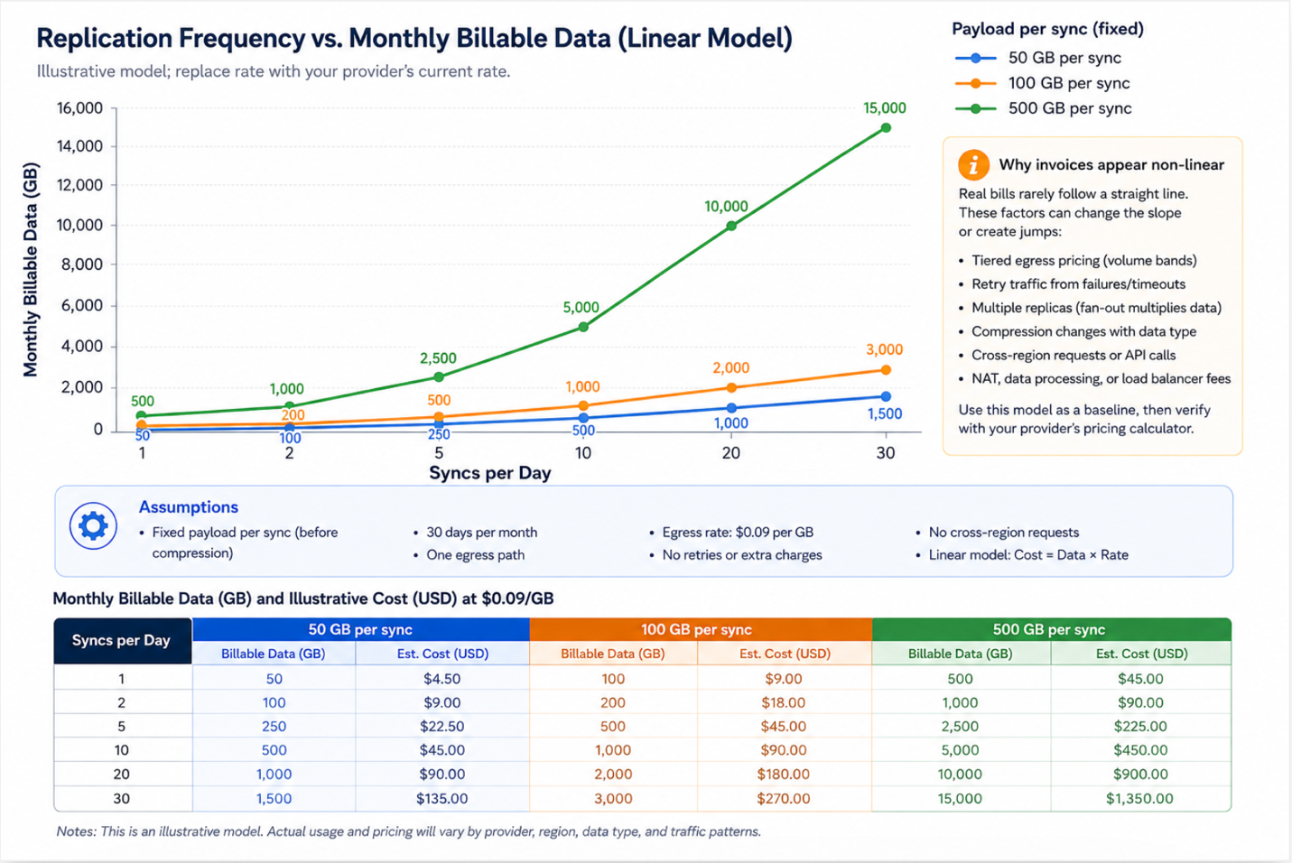
In the previous example, we looked at a 50 GB data transfer that occurs every four hours. But what if your team syncs more or less frequently depending on the performance requirements or replication settings? That single decision you made would change the monthly exposure.
We will calculate the total cost while keeping the payload and illustrative rate the same and changing the sync interval.
» Frequency changes the calculation
| Sync Interval | Syncs per Day | Monthly Data | Illustrative Cost at $0.09/GB |
| Every 24 hours | 1 | 1,500 GB | $135 |
| Every 4 hours | 6 | 9,000 GB | $810 |
| Every hour | 24 | 36,000 GB | $3,240 |
| Every 15 minutes | 96 | 144,000 GB | $12,960 |
Width: 0px, Height: 0px
Width: 1292px, Height: 863px
Width: 1292px, Height: 863px
Width: 1292px, Height: 863px
Width: 1292px, Height: 863px
Width: 1292px, Height: 863px
We assumed that you are transferring the entire 50 GB every single time in these calculations. However, your system may only send changed records, compressed payloads, incremental backup or transaction logs. That would change the volume substantially.
Having said that, if you send the same data to two different destinations, it will double your transfer volume. Repeated payload increases when you retry a failed request. Similarly, if one primary service sends an event to five downstream consumers, the total network movement will increase.
That’s why you need a more realistic formula to get the exact billable amount.
Monthly data = Payload size * transfers per day * days per month * number of destinations * retry factor
This will give you a single month’s total transferable data.
Monthly transfer cost = Monthly data * applicable rate
So, let’s calculate using the same data: 50GB sent over six times a day to two destinations with a 10% retry/overhead factor.
50 * 6*30*2*1.1 = 19,800 GB.
The amount at a $0.09/GB rate comes to
Monthly transfer cost= 19,800 *$0.09= $1,782
Now you know why that replication cost feels disconnected from the size of your database. Your invoice didn’t account for the size of your database. It was calculating how much data crosses the relevant billing boundary every single time a transfer occurred.
› What To Measure in Your Environment
Collect these numbers before making architectural changes. They turn your guess into a forecast.
» What to Measure Before You Make Changes
| Metric | Why It Matters |
| Bytes per sync | It tells you the size of each transfer |
| Changes per hour | Helps you separate full copies from incremental updates |
| Sync frequency | Shows how often each transfer repeats |
| Number of destinations | Captures all the replicas, backups, and fan-outs |
| Retry percentage | Reveals duplicated traffic |
| Compression ratio | Shows how much payload reduction is possible |
| Transfer route | Identifies the billing boundary along with the applicable rate |
| Monthly billed volume | You can compare the model with the invoice |
If replication is part of the picture, you would also want to know how much data actually changes and how often the secondary system refreshes. Replication costs increase when source data change volume is high, and the secondary system refreshes more often.
› The Inter-Region Cloud Data Audit
Auditing every single service line by line will burn time you don’t have. Start with the bill instead. Work your way backwards from there to find your traffic.
» Step#1: Find Your Transfer Line
Open the detailed cloud billing data instead of relying on your high-level monthly dashboard. Check for these categories and usage types.
- Data transfer out
- Inter-region transfers
- Internet egress
- Cross-zone traffic
- Network processing
- NAT gateway processing
- Interconnect or peering
- Replication traffic
The actual name of these categories or types will vary by provider or the service. For example, in AWS, data-transfer charges depend on service and source region. Calculating a general network total will not help identify what caused it.
The table below covers billing details worth recording.
» Billing Details You Must Record
| Billing Detail | What You Are Trying to Learn |
| Source account or project | Which environment generated the traffic you are considering |
| Source service | The workload that sent this data |
| Region | The region from where the transfer started |
| Destination | The place where the data was sent |
| Usage Quantity | How many billable GB or GiB were recorded |
| Rate | What was charged by the provider |
| Time period | When did the actual increase in volume begin |
| Cost centre or tag | Which team should investigate it |
If your bill shows only a broad category, export the detailed usage data. Combine billing records with network logs or service-level metrics to identify the responsible workload.
» Step#2: Map Traffic to a Workload
Once you know where that charge appears, compare it with your architecture. Create a simple map for the largest transfer paths.
» Mapping Traffic to Workload
| Source Workload | Destination | Data Being Moved | Frequency | Owner |
| Order Database | Disaster Recovery Database | Change records | Continuous | Platform team |
| Application Cluster | Search Service | Indexing Events | Every Request | Commerce Team |
| Production Logs | External Observability Tool | Logs and Traces | Continuous | SRE Team |
| Warehouse Exporter | Analytics Environment | Batch Files | Daily | Data Team |
Compare the billed volume with each workload report. If your billing system shows 10 TB outbound traffic but replication service reports indicate only 6 TB, investigate where that remaining 4 TB went. It could be retries, a second destination, or even logs.
» Step#3: Turn the Finding into Unit Cost
A monthly total states the problem. It is the unit metric that helps decide what you should do about it.
Cost per synchronization = Monthly transfer cost/Number of synchronizations
Also measure cost per million events, API requests, replicated gigabytes, egress cost per customer, per transaction, per backup, and per recovery point objective.
If your replication process costs $1800 per month and runs 4,320 times, the cost per synchronization would be $0.42.
It may sound like very little until you multiply this same process across databases, environments, and destinations.
A unit-based view makes every conversation easier. Instead of asking the engineering team to reduce network costs, check if you really need to run the sync every 15 minutes. Know if the same customer transaction is being transferred multiple times and whether each destination needs full payload.
Connecting anomaly detection to cost allocation lets you route unexpected spend to the team, product, or cost center that needs to investigate it.
If you don’t want to build this tracking manually, you can use cloud expense management platforms. They will automate most of this step for you.
Key Insight: Do not identify the charge. Give it an owner and a measurable business context.
› Reduce the Cost Without Migrating Clouds
None of this means abandoning your second cloud, tearing out replicas, or moving everything into one environment. It means reducing how much data moves, how often it moves, and how many times you are sending the same thing twice.
» Ways to Cut Costs Without Migrating Clouds
| Option | What You Change | Best Suited For | Trade-off to Consider |
| Incremental Sync | Send only new, updated, or deleted data | Databases where only a small portion changes | Increase in replication logic |
| Compression | Reduce the payload before transferring it | JSON, logs, and database exports | More CPU usage |
| Local Caching | Keep frequently requested data closer to the service | Read-heavy workloads | Cached data becomes outdated |
| Read Replicas | The read copy should be closer to the application | Continuous database reads | Need to manage more copies |
| Lower sync frequency | Synchronize less | Systems with flexible recovery targets | More time between two updates |
| Private Connectivity | Review peering/private links | High volume and predictable traffic | Connection and operating costs |
» Send Data That Changed
Consider only change-data capture or incremental backups instead of sending a full database copy for every sync. These methods send only updated, new, or deleted records. They don’t repeat data present in the destination.
It is best suited when only a small part of the database changes between syncs. You will still need to manage ordering, failures, and even recovery. But with this method, you will note a significant reduction in transferred data.
» Compress Your Payload
Compression reduces the physical size of data you are moving between clouds. You can use it to transfer text-heavy formats, such as JSON, logs, and database export files.
Consider a more compact format like Protocol Buffers for high-volume service communication. Measure the trade-off before you make this change. Compression may reduce egress volume, but increase CPU usage and processing latency.
Both compression and deduplication are data-efficiency techniques FinOps uses to reduce the amount of data stored and transferred.
» Keep Frequently Used Data Closer
If services in Cloud A continuously request data from a database in Cloud B, you should check whether these reads can occur locally. A regional cache, local read replica, and even precomputed results can reduce repeated cross-cloud requests.
Don’t copy everything everywhere. Start with read-heavy, latency-sensitive data that is requested frequently and changes relatively slowly.
» Review The Transfer Path
Compare public internet routing with private connectivity, peering, or provider interconnect options for predictable and high-volume traffic. These alternatives improve predictability. But they aren’t cheaper. Weigh the connection, processing, and operational costs against one another before making the decision.
Reduce the sync frequency if your recovery-point objective allows it. For example, a 15-minute replication cycle is necessary for one system and seems extensive for another.
Your goal with cost reduction is not to make the architecture less reliable. It is to ensure redundancy and performance you are paying for match what your business actually needs.
» Governance and Buying Questions
Once you have identified transfer behind the bill, decide who will monitor it. Engineering understands architecture, and finance tracks impact. That’s exactly why both teams need eyes on egress costs together, not separately.
Assign each traffic path to a product, service, or team to review changes monthly.
» Buying Questions with Reasoning
| Question | Why Ask? |
| Which service creates the traffic? | To assign ownership |
| How often must your data move? | To test the entire schedule |
| What will each sync cost? | Show unit economics |
| Can alerts detect a spike? | Prevent bill-related shocks |
| Do rates differ by the route? | Helps improve forecasting |
| Are discounts/credits available? | Supports negotiation |
| What will migration cost later? | Measure lock-in risk |
Your goal is not to stop every transfer. It is to make each cost visible, owned, forecastable, and justified.
› Conclusion
You may be using software that solves an important business problem. But it can create easy-to-miss multi-cloud data egress fees. Look beyond the subscription price while choosing a platform. Check how it stores, replicates, exports, and moves your data.
Compare the likely software fee, cloud usage, storage, integrations, and even egress charges as your total cost of ownership.
Use our reviews and listings to investigate the pricing, transparency, infrastructure requirements, and long-term operating costs when comparing software platforms. Explore the platforms, compare your options, and choose software with a clearer view of what you will pay after implementation.
Always ask your vendors for scenario-based egress cost estimates, both volume- and region-specific.
› FAQs
1. Are cloud egress fees uncapped?
Ans. It is possible. Your provider agreement, quote, automated control, or budget alert must control limits. Otherwise, your charges will increase as more data leaves your cloud environment. Always treat egress as potentially uncapped till you confirm limits that apply to your accounts and services.
2. Is data ingress always free?
Ans. No. Ingress is often free but, in some cases, pricing varies by service, region, network path, and provider. Google Cloud offers free ingress in most scenarios. But it charges separately for egress and inter-region traffic. Check the rate card for your specific transfer before proceeding.
3. What is the fastest way to find the source?
Ans. Start with detailed billing data and filter it for data transfer, inter-region, cross-zone, network processing, or NAT charges. Compare major usage entries with network flow logs, service traffic, and replication metrics. Track daily service-level spend instead of monthly totals to hide anomalies. This will help link every charge to a database, backup job, service or export pipeline causing it.