On this page
Your customer asked why you are delaying a promised feature release. The leadership team starts reviewing their request. Support provides ticket history, product gives a roadmap update, marketing shares feedback from a recent campaign, and finance reveals renewal data.
Each team opens a different platform, exposes part of the story, and waits for the leadership team to connect the dots. This is more than a workflow inconvenience.
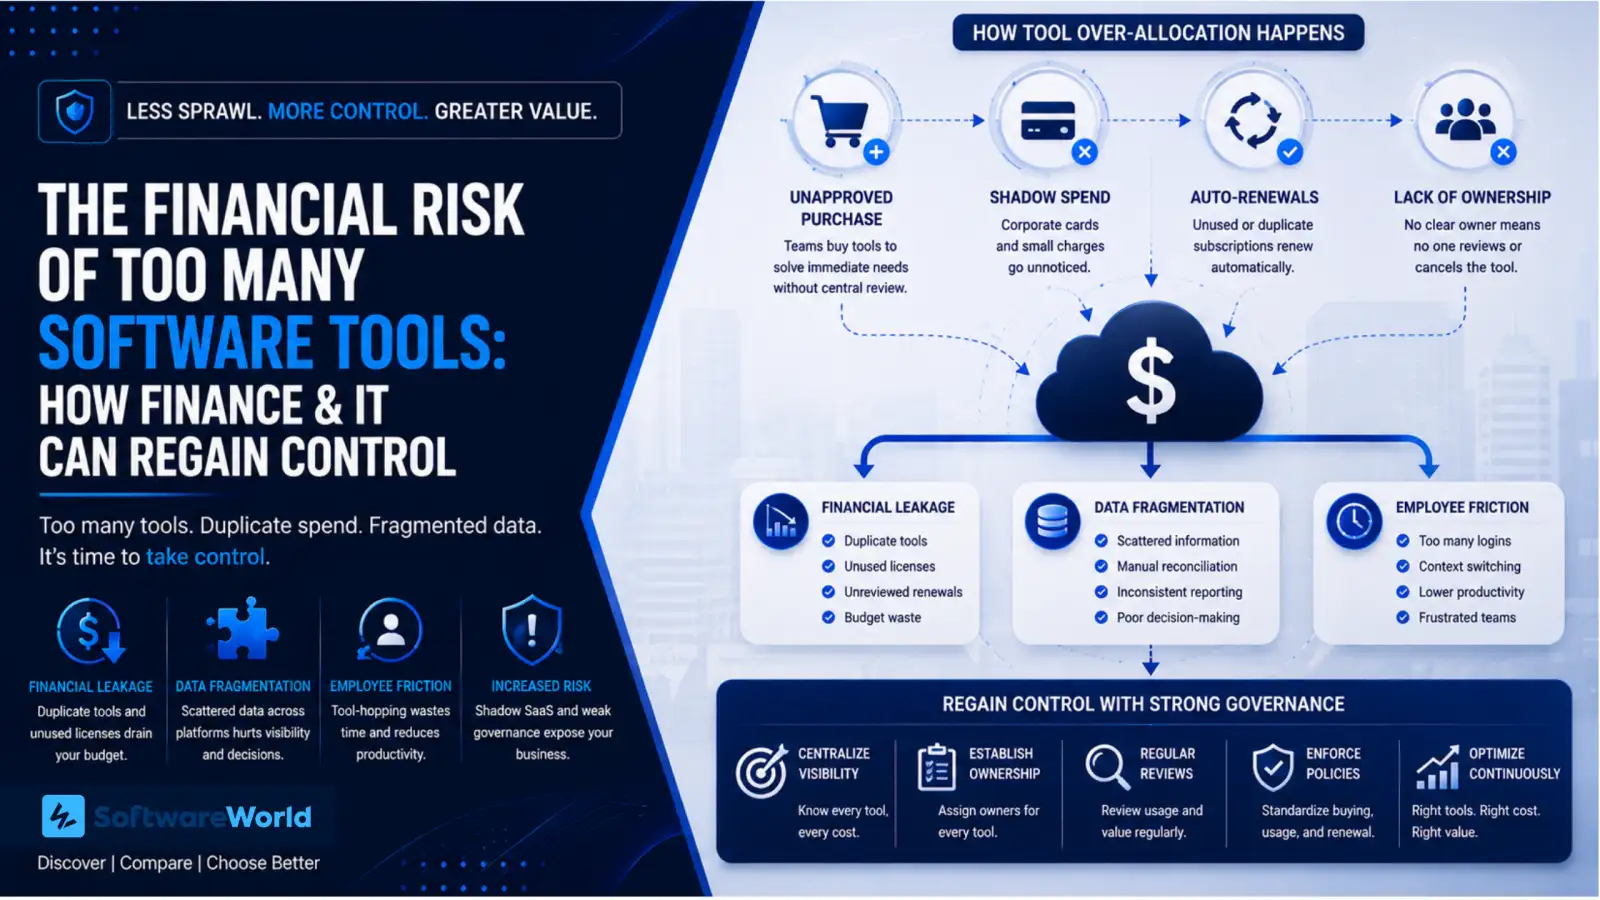
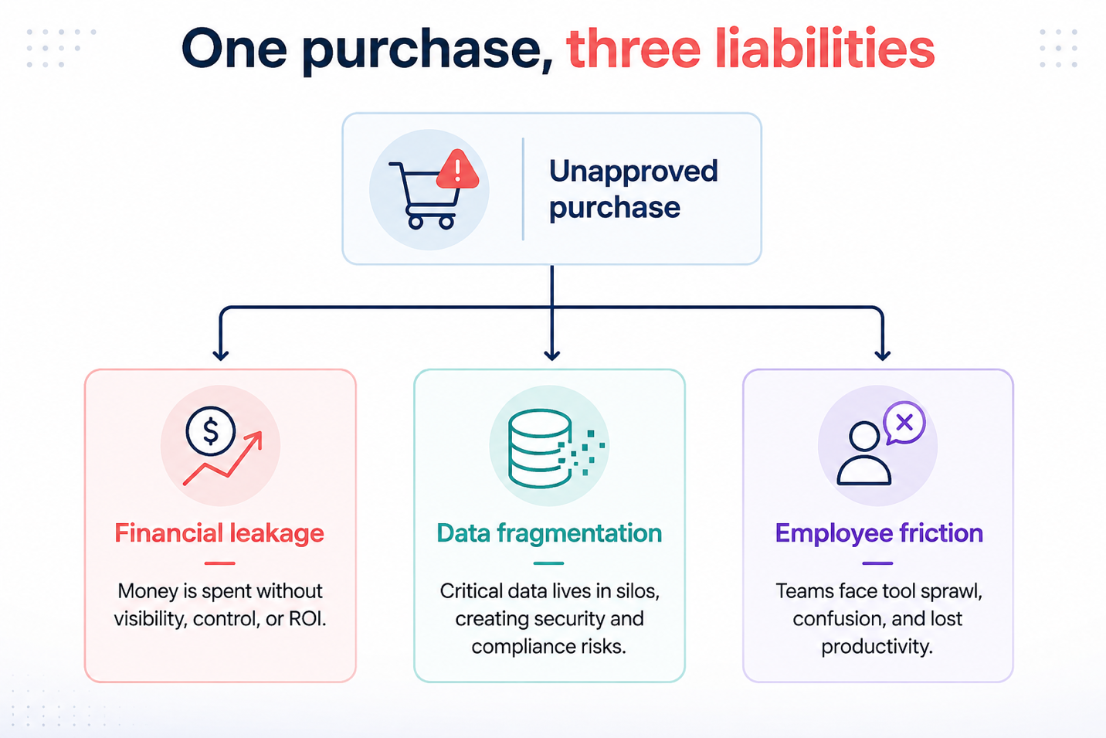
Too many software tools create financial risk when departments buy overlapping applications without shared ownership or visibility. It results in duplicate spend, unreviewed renewals, fragmented data, and increased time switching between systems.
Disadvantages of too many software tools rarely appear as one alarming issue. They build quietly, in the reports that need manual reconciliation between teams or the unused subscription that renews automatically but offers no value.
For your finance and IT teams, software over-allocation becomes a governance issue. The goal isn’t to eliminate every specialised tool. It is to ensure each tool has a clear purpose, owner, and data boundary.
This article breaks down where SaaS spend leaks happen, how overlapping tools fragment business data, and the governance model your IT and finance teams must use to catch these issues before the renewal cycle.
Width: 0px, Height: 0px
Width: 1106px, Height: 738px
Width: 1106px, Height: 738px
Width: 1106px, Height: 738px
Width: 1106px, Height: 738px
Width: 1106px, Height: 738px
Width: 1106px, Height: 738px
Width: 1106px, Height: 738px
Width: 1106px, Height: 738px
Width: 1106px, Height: 738px
› Why Software Tool Over-Allocation Happens
No department sets out to create a mess. Most overlapping tools were bought with good intentions. They had to move fast, so they found a tool that solved the problem immediately and bought it.
But here are the terms that tell you what happens when you add more tools to your ecosystem.
| Term | Definition | Executive Consequence |
| SaaS Sprawl | A growing number of cloud tools that provide limited central visibility | You will find it difficult to track spend and risk |
| Duplicate Software | Two or more software tools within your business that aim to solve the same requirements | The company pays multiple times to achieve the same capabilities. |
| Shadow SaaS | Software bought or used outside approved IT/procurement processes | IT cannot assess the data, integrations, or security |
| Tool Over-Allocation | More tools, seats, and overlapping capabilities that you are unable to justify | Cost grows faster than the value they provide. |
The pattern is consistent across your business. A department buys a product to solve an immediate problem, bypassing procurement. The free trial converts into a paid subscription without a clear owner. Renewals happen even before anyone can check if the tool is needed, and reorganisation lets go of the very tool that you had bought long back.
This doesn’t make decentralised buying wrong. It just discloses the risk that begins when speed doesn’t match shared visibility, clear ownership, and renewal plans.
› How Do Corporate Cards Create Hidden SaaS Spend
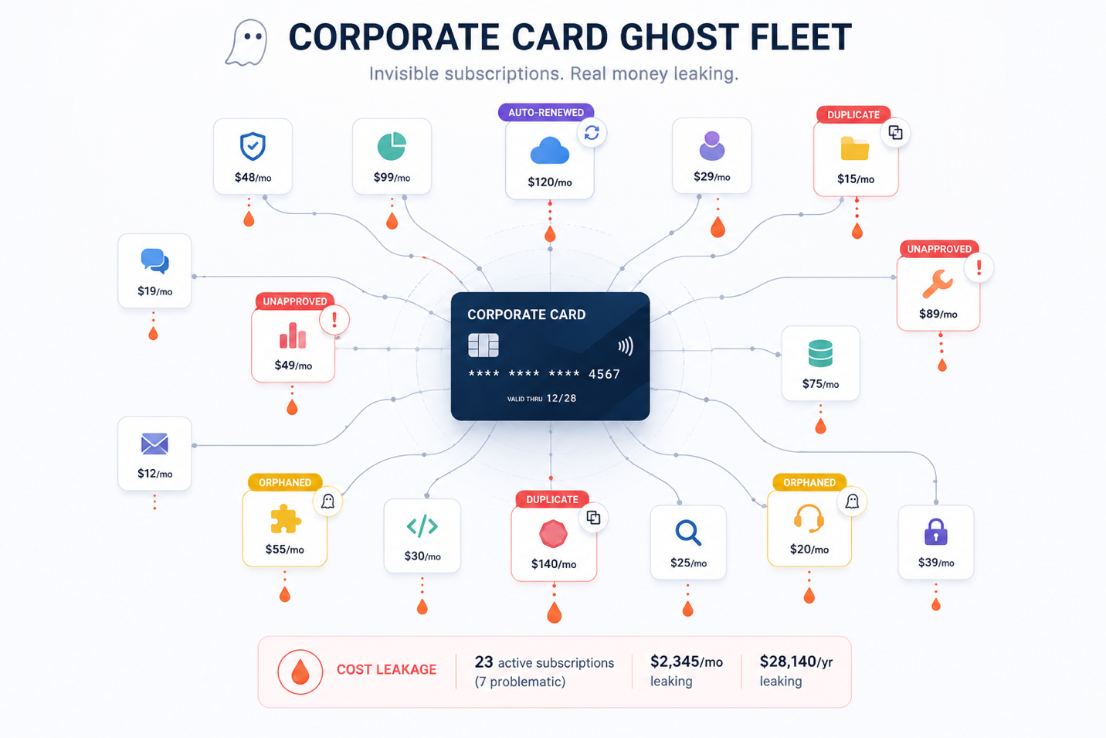
Most SaaS leakage doesn’t come from a single large purchase. Rather, it comes from small charges that you overlooked.
Width: 0px, Height: 0px
Width: 0px, Height: 0px
Width: 1106px, Height: 738px
Width: 1106px, Height: 738px
Width: 1106px, Height: 738px
Width: 1106px, Height: 738px
Width: 1106px, Height: 738px
Width: 1106px, Height: 738px
Width: 1106px, Height: 738px
They often sit below procurement thresholds and appear under vague merchant names on the statement. Spread across cost centres, there isn’t a single line item large enough to raise questions. But the employee who bought that tool leaves without removing the subscription.
» How does it look in practice?
Here’s a simple and illustrative example to explain it.
Consider a 250-person company with three teams. Each pays for their own project-management platform, meeting notes tool, and survey platform. That creates a total of nine subscriptions across three capabilities, many serving the same needs.
Now, let’s calculate for a single duplication: project management platform. Together, the three teams hold 60 seats at $40 per seat. Across 12 months, that costs you $28,800.
This total is before considering admin time, integration workarounds, and reporting gaps caused by each of these platforms.
Zylo’s 2026 SaaS Management Index found that organisations leave an average of 36% of SaaS licenses unused against recommended utilisation levels. It also found that business units control 81% of SaaS spend while IT directly manages the 15%. This is the gap that makes decentralised purchases difficult to govern.
No invoice ever shows this cost to procurement or leadership.
› Where Does This Cost Hide
This table shows your leakage source, what happens, and how it impacts the business.
| Leakage Source | What Finance Sees | What is Actually Happening | Business Impact |
| Duplicate Platforms | Several small monthly charges | Different teams bought similar tools helping with the same workflows | Duplicate licenses and lose volume discounts |
| Orphaned Accounts | Recurring vendor charge | Former employees and inactive teams may still hold seats | Paying for access nobody is using |
| Unreviewed Renewals | Predictable annual invoice | Contract renews before you can assess usage | Budget is committed to low-value software |
| Unapproved Data Tools | Payment through corporate card | Sensitive business or customer data is present with tools outside the approved systems | Compliance and security exposure risks |
| Integration Workarounds | Spend time and money on connectors and manual exports | Tools don’t share common data models | Hidden operational costs with unreliable reporting |
An invoice doesn’t prove the value of the tools; usage, ownership, and data exposure do. Getting ahead of this starts with complete visibility into where SaaS spend actually goes.
› The Hidden Operating Cost: Data Silos, Weak Reporting and App Fatigue
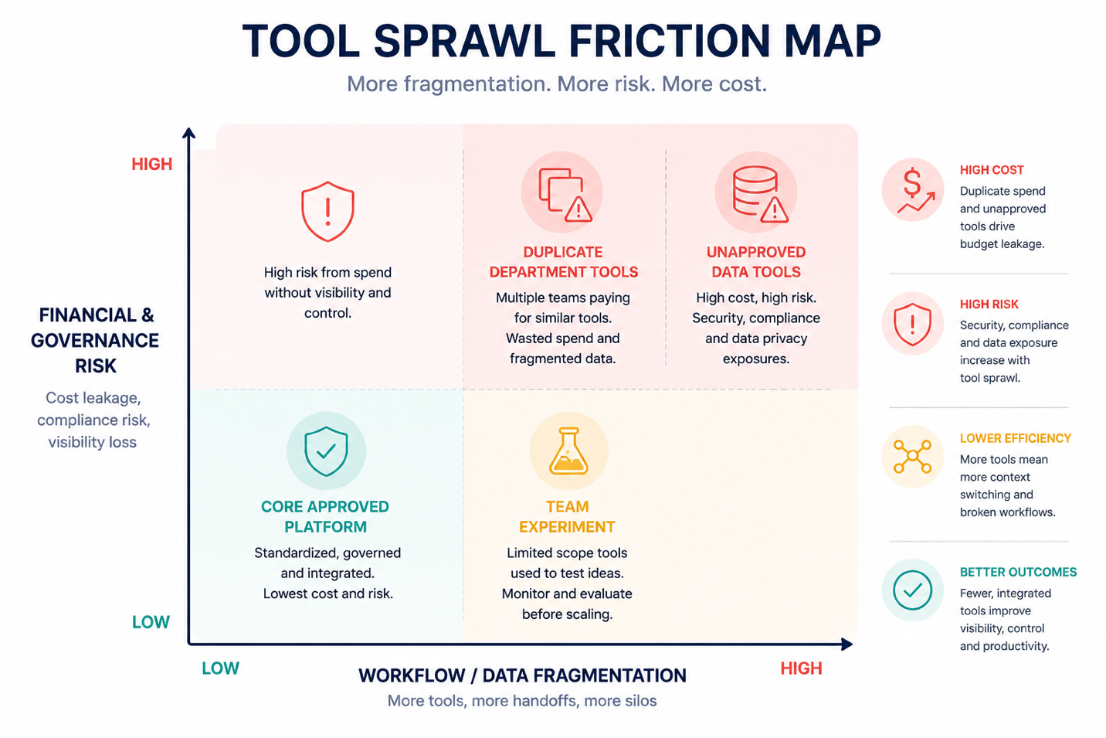
The cost of software overlap doesn’t end with duplicate subscriptions. It affects how information moves through the business.
Fragmented Data
Width: 0px, Height: 0px
Width: 1106px, Height: 738px
Width: 1106px, Height: 738px
Width: 1106px, Height: 738px
Width: 1106px, Height: 738px
Width: 1106px, Height: 738px
Width: 1106px, Height: 738px
Width: 1106px, Height: 738px
Three feedback tools do not give a company three times the customer insight. They simply create three partial datasets with different tagging systems. In truth, they cannot even provide a reliable answer to the simple question: what are customers actually asking for?
Someone has to export the sales logs from one tool, feedback from another, and marketing survey results from the third one into a spreadsheet. That becomes the working source of truth, built manually, updated consistently, and never trusted completely.
» Reporting Gaps
When your teams use different systems to track the same project, customer, or even metric, reporting becomes more of a reconciliation. Finance may note one renewal figure, sales reports a different account status, while customer success has the latest customer feedback.
No team is completely wrong. It’s just that no one knows which system owns which data. That eventually creates several gaps, causing decision gaps.
» App Fatigue
This doesn’t mean you count the minutes lost per app switch. It is just about noting the patterns. An employee has to move between a messaging tool, a task tracker, a document system, and a customer database to answer a single question. Each switch they make requires a separate login, search, and recheck. Over time, these same tools stop saving your time and start consuming it.
The hidden operating cost signals are easy to spot when you know where to look.
| Signal | Low-Risk Environment | High-Risk Environment |
| Application Ownership | Every business-critical tool has an accountable owner | No one owns usage, renewal, or data quality |
| Data Flow | Approved systems integrate around | Teams export, re-upload, and reconcile data manually |
| Procurement | Purchases go through overlap and security reviews | Corporate card is used to purchase them, making it the permanent system |
| Employee Workflow | Core work uses a small and connected set of tools | Employees switch between multiple apps to find basic information |
| Reporting | Metrics are defined and sourced consistently across your organisation. | Each department has a different version of the same number |
This pattern is very common and measurable. Zylo’s 2024 Index found 70% of underutilised SaaS contracts were renewed anyway in 2023.
Tool count isn’t the real metric. What actually matters is whether your employees can trust the data, act on it immediately, and complete work without stitching together disconnected systems.
› A Better Question Than Which Tools Should We Cut?
It’s tempting to solve your software sprawl with a number. Let’s cut 20% of the stack or set a hard cap on subscriptions, you say. It feels decisive but doesn’t address the real problem.
Forcing standardisation can penalise your teams for choosing a particular tool for a valid reason. Your design team using specialist prototyping software isn’t the same as three teams running duplicate survey platforms.
You miss the point by treating both situations the same way.
The better question is not “how many tools do we have?” It is: which capabilities should be standardised, which should remain team-specific, and who is accountable for the cost and data each tool creates?
That question changes your approach. High-risk, cross-functional tools should be standardised, especially those handling financial data, customer information, or company-wide reporting. Lower-risk areas can remain open to controlled experimentation.
Make one non-negotiable rule: every paid tool needs an owner, a clear purpose, renewal decision data, and data classification before you begin using it.
The goal is not to build the smallest possible stack. Build an intentional one where every tool earns a place, and someone can explain why it exists.
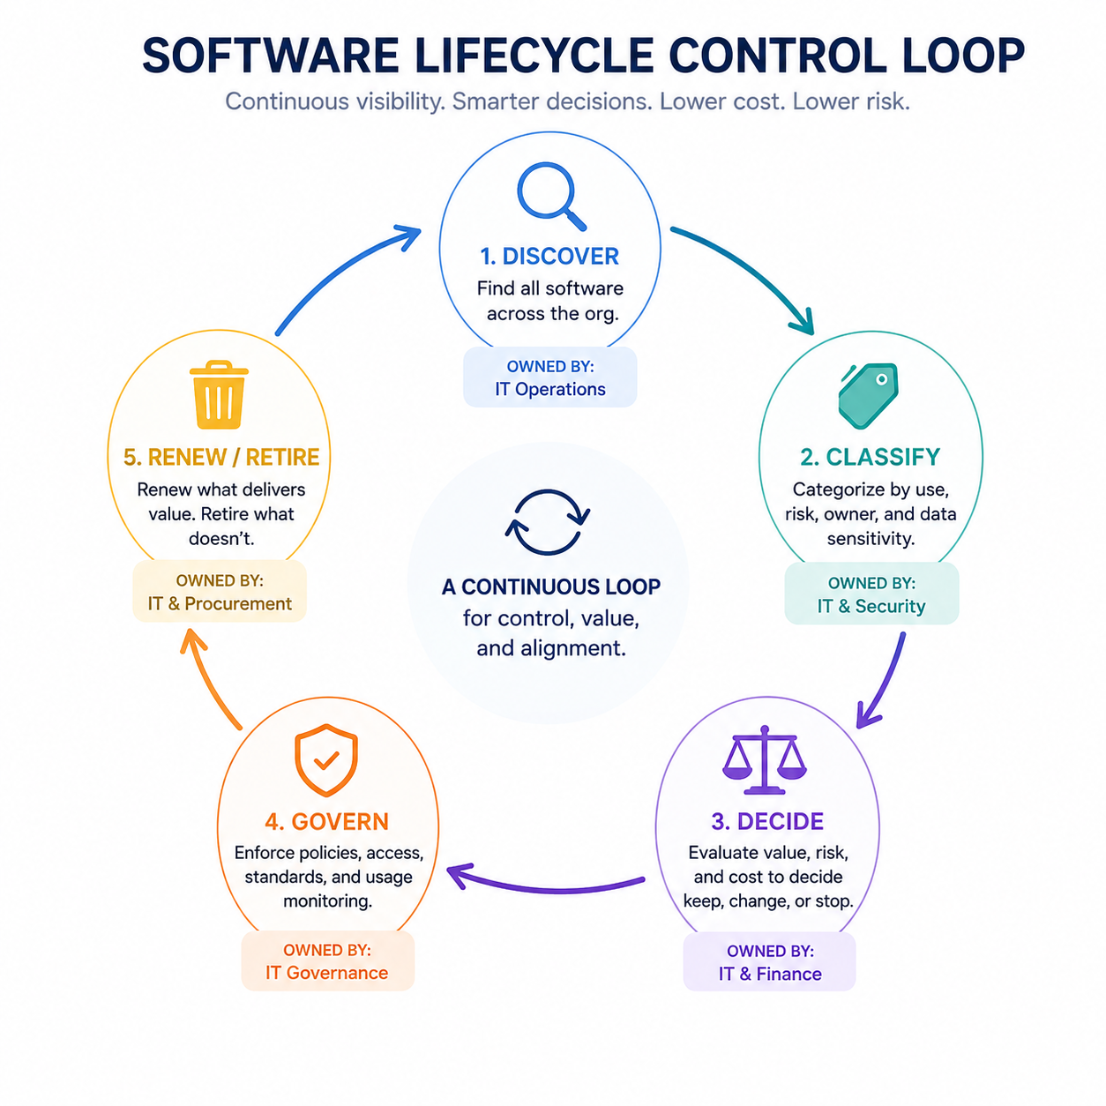
› A Four-Part Control Model to Manage Disadvantages of Too Many Software Tools
A one-time audit fixes this year’s problem. A cycle, from discovery to governance, prevents it from becoming a continuous business problem.
» Discover
Start with every place money leaves the company. These include AP records, expense claims, procurement contracts, renewal calendars, and corporate card statements.
Capture the vendor, department, annual cost, seats purchased vs. active seats, data it manages, and the owner for every tool.
» Classify
Sort tools by the job they perform and not what they are called. For instance, project management, CRM, surveys, messaging, analytics, and AI notes.
Ask these five questions for each tool.
1. Does it offer something unique?
2. Is there an approved tool that provides something similar?
3. Does it hold customer and financial data?
4. Is usage high enough to justify seat count?
5. What breaks in the organisation if it is removed?
» Decide
During the decision stage, you must know if you want to keep it or retire it. This table shows what each decision means.
| Resolution | When It Applies |
| Retain | If the tool is continuously used, provides distinct capability, and has at least one accountable owner |
| Consolidate | Multiple tools serve the same business need |
| Downgrade | The tool is useful, but the current plan or seat count exceeds actual usage |
| Retire | The tool doesn’t have a clear owner or has low adoption |
Width: 0px, Height: 0px
Width: 1106px, Height: 1106px
Width: 1106px, Height: 1106px
Width: 1106px, Height: 1106px
Width: 1106px, Height: 1106px
Width: 1106px, Height: 1106px
This is where most companies stop this cycle. A clean-up without proper governance simply recreates the same gaps within the next year.
| Decision | Who Approves | Threshold |
| New tool under defined spend limit | The department’s lead after conducting and logging an overlap check | Under $X per year |
| New tool above that limit or handling customer/financial data | Finance and IT/Security jointly | Any amount |
| Cross-department tool used by more than one team | CIO or the designated software owner | Any amount |
| Upcoming renewals for purchased tools | Department owner along with finance. They should sit down at least 90-120 days before the contract ends | Every renewal |
Here are the lightweight guardrails you should use to do most of the work.
- Shared intake form for software requests
- Mandatory overlap check before approving
- Finance visibility into recurring charges on the corporate card
- Quarterly review of tool adoption and upcoming renewals
Governance needs proof that it’s working. Track these metrics every quarter to see if your organisation is reducing duplicate spend or improving accountability.
» Measure
This table shows how you can measure if your audit cycle is working and whether it has helped you protect SaaS leaks.
| Metric | Why It Matters | Owner |
| % of SaaS spend with a named owner | Makes accountability transparent and visible | Finance and respective department leads |
| % of applications discovered outside procurement | Measures the corporate card blind spot | Finance and procurement |
| % of active users as a share of paid seats | Identifies underutilization of the tool | IT and application owner |
| Number of tools per core capability | Determines overlaps that exist | CIO/enterprise architecture |
| Spend due for renewal in the next 120 days | Creates time to negotiate or plan exit | Procurement and finance |
› The Goal Is Not Fewer Tools. It is Fewer Unmanaged Decisions
A company can run dozens of tools and still remain in control. The disadvantages of too many software tools were never about the count itself. The risks start when no one on your team can explain why a tool exists, who owns it, when it needs to be renewed, and how often it is used.
Finance needs visibility on where the money goes while IT needs governance over data. Your employees need workflows that can answer a question without moving to five different logins. Procurement just wants to prevent duplicate purchases before they become permanent subscriptions they cannot justify.
Let’s return to that leadership meeting we had at the start, where four teams went to four different platforms and returned with no clear answer. That is not a workflow glitch. It is what you see when software decisions are made one purchase at a time, with no clear visibility or accountability.
Before you approve another subscription, compare it with what is already present in your organisation. Conduct a structured review of features, security needs, integrations, and adoption. This will give you a clear demarcation between something that’s useful and one that is a recurring purchase liability.
Audit your software stack before the next renewal cycle to avoid letting another overlapping tool become the next year’s unexplained line item.
› FAQs
1. What is SaaS sprawl?
Ans. SaaS sprawl happens when you accumulate cloud software faster than you can track, govern, or manage it. It starts when separate departments buy tools without offering central visibility. With time, this creates overlapping subscriptions with fragmented data and no clear owner accountable for cost or renewal decisions.
2. How do corporate cards contribute to duplicate software spending?
Ans. Using corporate cards, your employees can purchase software without having procurement or IT review them. As these charges are small or spread across cost centres, you cannot flag them individually.
But the combined cost and data/security risk of these unreviewed tools can be significant. You can cover these gaps by cross-checking card transactions and expense claims.
3. How often should an organisation audit its software stack?
Ans. Run a complete software-stack audit at least once a year. Add a quarterly light review focused on low-usage tools, upcoming renewals and new purchases.
Review major contract renewals 90-120 days ahead. This way, your finance, IT, and procurement teams can check usage, evaluate overlapping tools, reduce unused seats, and negotiate terms before auto-renewal comes into effect.